Investment Management - Second Quarter 2021

We provide a copy of our investment management letter, without enclosures, to keep you up-to-date on the investment markets and West Financial Services.i
Don’t Stop Believin’
Do you remember the song “Don’t Stop Believin’” by the band Journey? Chairman Jerome Powell of the Federal Reserve (“Fed”) does and he is telling us that inflation is transitory. The Fed can taper quantitative easing (“QE”) without disrupting equity and bond markets, the unemployment rate will continue to drop and that we will have dynamic growth ahead of us. In other words, QE “may go on and on, and on and on.”
Central bankers around the globe find themselves painted into a corner. To combat the pandemic, governments and central banks flooded the capital system with stimulus both monetary and fiscal. With many economies recovered, or on-the-way to recovery, these economic stewards have begun the thought process of withdrawing emergency funding. What will be especially difficult, is convincing market participants that it can be done without disrupting asset prices or economic recovery. Along the way to normalization, there are several cross currents. Inflation is a major topic, with investors concerned over the long-term implications of easy-money policies. There are also concerns over a new variant of COVID-19 causing case numbers to rise, though hospitalization and deaths are not following. Meanwhile, global economic growth is forecast to decelerate as larger economies, in particular, China and the United States, are “peaking” in terms of their growth rates. These central bankers are asking for our trust, that they can navigate the economy through. And as noted in the lyrics, “some will win and some will lose.”
Over the last three months, equity markets continued to flourish as economic growth powered first quarter corporate earnings well-ahead of Wall Street’s expectations. This propelled several major indices to new all-time highs. The total return of the S&P 500 was 8.55%. Mid and small capitalization indices, represented by the S&P 400 and S&P 600, returned 3.64% and 4.51%, respectively. International stocks rose 5.17% during the quarter, as economic growth improved in Europe while the U.S. dollar declined slightly.
Performance for various indices for the year-to-date (not annualized), one-year, three-year, and five-year periods appears below:
Bond Indices
| Dates | Barclays Credit 1-5 Yr. | Barclays Cap US Credit Index | Barclays Muni |
|---|---|---|---|
12/31/20- 6/30/21 | 0.04% | -1.28% | 1.06% |
6/30/20- 6/30/21 | 1.81% | 2.99% | 4.17% |
6/30/18- 6/30/21 | 4.43% | 7.42% | 5.10% |
6/30/16- 6/30/21 | 2.92% | 4.63% | 3.25% |
Equity Indices
| Dates | Dow Jones Ind. Avg. | NASDAQ Composite | S&P 500 (Large) | S&P 400 (Medium) | S&P 600 (Small) | MSCI EAFE (Int'l) |
|---|---|---|---|---|---|---|
12/31/20- 6/30/21 | 13.79% | 12.92% | 15.25% | 17.59% | 23.56% | 8.83% |
6/30/20- 6/30/21 | 36.34% | 45.23% | 40.79% | 53.24% | 67.40% | 32.35% |
6/30/18- 6/30/21 | 15.02% | 25.72% | 18.67% | 13.17% | 12.20% | 8.27% |
6/30/16- 6/30/21 | 16.66% | 25.80% | 17.65% | 14.29% | 15.82% | 10.28% |
Investors are paying attention to a peak growth scenario as observed by the outperformance of secular growth stocks during the quarter — namely in enterprise software/cloud computing, semiconductors, online advertising, and health care equipment. Cyclical stocks, primarily industrial and transportation companies, outperformed and then underperformed late in the quarter, as long-term interest rates broke below key levels.
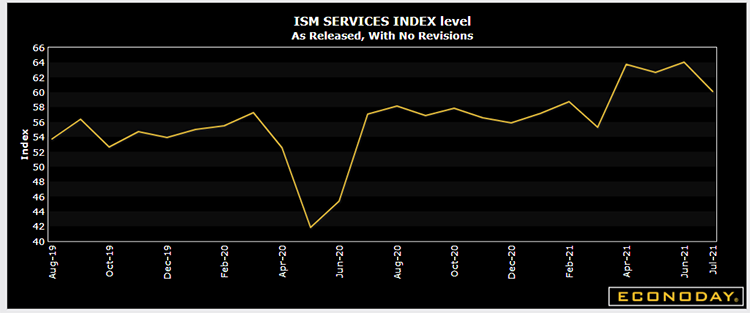
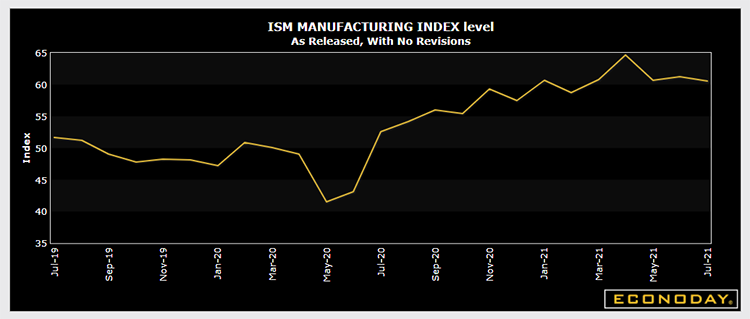
While the U.S. economy is currently running hot, we suggested in our last letter that we believed several data points were too strong to be sustainable. Current economic releases seem to indicate that to be the case, and several economists are forecasting further deceleration in the second half. The ISM Services Index, which covers over 80% of the U.S. economy, came in at a record 64 for May. June’s ISM Services Index unexpectedly fell to 60.1, which is still a very strong number. Prices paid remained extremely high reflecting the supply chain issues. The ISM Manufacturing Index slowed slightly from a record 64.7 in March, to 60.6 in June, though this is still a robust number. One of the likely reasons for the slowdown is a high backlog in orders, due to a lack of materials.
ISM Services Indexii
ISM Manufacturing Index Graphiii
At present, the Fed is purchasing $80 billion of treasuries and $40 billion of mortgage backed securities each month.iv By doing so, they are helping to keep longer term interest rates low, allowing for cheaper borrowing by both corporations and individuals. At the most recent (June) Federal Open Market Committee meeting, the Fed affirmed that they will keep the Fed funds rate (very short term interest rates) at essentially 0% and will continue these asset purchases.
When will they taper or reduce the amount of these purchases? Tapering and/or eliminating these purchases will likely need to occur before any rate hikes. The last time the Fed announced they “may” stop asset purchases happened in 2013 and resulted in the infamous “taper tantrum.” In 2013, Fed Chair Ben Bernanke announced the Fed would end the bond purchases which were supporting the markets since the 2008 financial crisis. Bonds sold off and equity markets experienced a swift decline, but in the end, there was no need to panic and markets recovered.
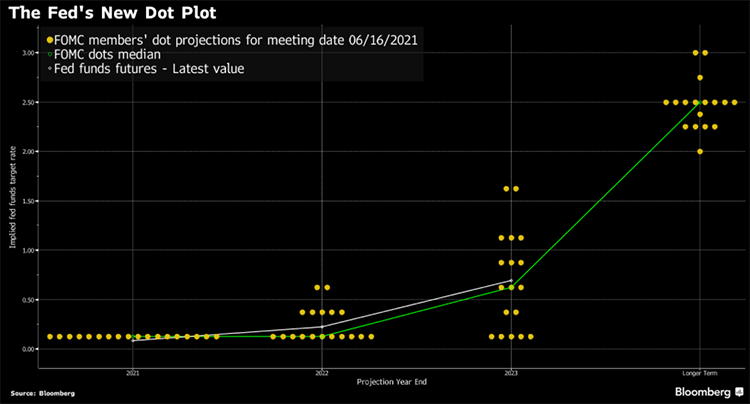
At the June Fed meeting, a new dot-plot was released. The dot-plot illustrates the future outlook for interest rates by the 18 Fed members. This latest dot-plot predicts two 25 basis point rate increases in 2023. 7 of 18 dots are showing 1 or 2 increases in 2022.
The Fed's New Dot Plot Graphv
Will that be enough to stave off runaway inflation? The most recent CPI reported inflation running at a 5% rate. As we previously discussed, comparing the price change from last year during lock-downs, does not provide an appropriate basis for comparison. The Fed’s preferred measure of inflation, the Personal Consumption Expenditure index (PCE) rose 3.9% from a year ago. The core number, excluding food and energy, was up 3.4%. CPI numbers are generally higher than PCE due to different calculations, but no matter how one looks at it, inflation numbers are running hot. Price increases are magnified given the depths of the pandemic last year, supply chain bottlenecks that are pushing prices up, and pent-up demand from consumers. In fact, we are seeing the fastest rise in price increases since 1992.
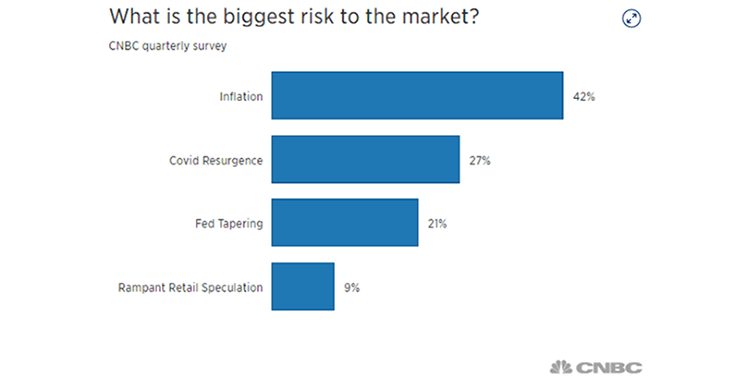
According to CNBC, in their quarterly survey of 100 investment professionals, inflation was the top choice as the biggest risk to the equity markets.
What is the Biggest Risk Graphvi
Currently, the sectors reporting high inflation levels appear to be transitory. In other words, as supply chain issues are resolved and employment returns to normal, price pressures should ease. However, the Fed also has a mandate for full employment. Policymakers are eager to return to full employment, but there are approximately 8 million fewer jobs than prior to the pandemic, and at the same time, there is a shortage of workers. The Federal Reserve has broadened their mandate to ensure that the recovery is beneficial for all Americans. They are examining individual categories of employment to make sure that lower income households are participating.
For our client portfolios, we still favor equities over fixed income, and are allowing allocations to run higher relative to target for clients with higher risk tolerance and those with longer time horizons. Over the long run, we believe equities are better positioned as a hedge against inflation. We continue to build our bond ladders out to approximately 2028 primarily with corporate bonds. Municipal bonds remain expensive relative to yields, with AAA 10-year municipal bonds yielding less than 1%. With all of these crosscurrents, this is a great time to meet with or speak with your relationship or portfolio manager.
*****
We would like to welcome our newest employee, Patrick (Pat) Fitzgerald. Pat joined West Financial in June as a portfolio manager. He holds an MBA and is a CFA charterholder. West Financial is growing, thanks to you!
Enclosed you will find your portfolio appraisal as of June 30, 2021. We have provided performance numbers for the year-to-date, one-year, three-year, and five-year periods, where applicable. We have included our annual Privacy Notice, stating our policy on the confidentiality of client information. If you wish to opt out of sharing information, other than that which is required by law, please complete the form and mail it to the West Financial or the Sandy Spring Bank address provided on the form. If you prefer, you may also opt-out by calling the number listed on the Privacy Notice.
If you haven’t visited our website recently, we are featuring blogs written by our staff. Topics range from college planning to car racing. Please take a look for some interesting reading. And, if you have a song title that you think reflects today’s markets, let us know! Referrals of family, friends and colleagues who may benefit from financial planning and investment management guidance are always welcome. Thank you for recommending our firm and your continued trust in our financial planning and investment management services.
President | Chief Investment Officer | Director of Fixed Income |
|---|---|---|
 |  |  |
| Glen J. Buco, CFP® | Glenn Robinson, CFA | Norma Graves, CFP® |
iEach of the S&P 500 Index, the S&P 400 Index, the S&P 600 Index, the MSCI EAFE Index, the Barclays Credit 1-5 Year Index, the Barclays Cap U.S. Credit Index, the Barclays Capital Municipal Bond Index, the Dow Jones Industrial Average, and the NASDAQ Composite (each, an “Index”) is an unmanaged index of securities that is used as a general measure of market performance. The performance of an Index is not reflective of the performance of any specific investment. Each Index comparison is provided for informational purposes only and should not be used as the basis for making an investment decision. Further, the performance of your account and each Index may not be comparable. There may be significant differences between the characteristics of your account and each Index, including, but not limited to, risk profile, liquidity, volatility and asset comparison. The performance shown for each Index reflects no adjustment for client additions or withdrawals, and no deduction for fees or expenses. Accordingly, comparisons against the Index may be of limited use. Investments cannot be made directly into an Index.
iiISM Services Index Graph - Page 2, Graph 1: http://fidelity.econoday.com/byshoweventfull.asp?fid=522778&cust=fidelity&year=2021&lid=0&prev=/byweek.asp#top.
iiiISM Manufacturing Index Graph - Page 2, Graph 2: http://fidelity.econoday.com/byshoweventfull.asp?fid=522766&cust=fidelity&year=2021&lid=0&prev=/byweek.asp#top.
ivhttps://www.federalreserve.gov/monetarypolicy/files/monetary20210616a1.pdf.
vThe Fed’s New Dot Plot Graph - Page 3: https://www.bloomberg.com/news/articles/2021-06-16/the-fed-s-new-dot-plot-after-its-june-policy-meeting-chart.
viWhat is the biggest risk to the market Graph – Page 4: https://www.cnbc.com/2021/07/01/investors-see-value-stocks-like-banks-leading-the-way-in-the-second-half-cnbc-survey-finds.html.
West Financial Services, Inc. (“WFS”) offers investment advisory services and is registered with the U.S. Securities and Exchange Commission (“SEC”). SEC registration does not constitute an endorsement of the firm by the SEC nor does it indicate that the firm has attained a particular level of skill or ability. You should carefully read and review all information provided by WFS, including Form ADV Part 1A, Part 2A brochure and all supplements, and Form CRS.
The information contained herein does not constitute investment advice or a recommendation for you to purchase or sell any specific security. You are solely responsible for reviewing the content and for any actions you take or choose not to take based on your review of such content.
This information is intended to be educational in nature, and not as a recommendation of any particular strategy, approach, product or concept. These materials are not intended as any form of substitute for individualized investment advice. The discussion is general in nature, and therefore not intended to recommend or endorse any asset class, security, or technical aspect of any security for the purpose of allowing a reader to use the approach on their own. Certain information contained herein was derived from third party sources as indicated. While the information presented herein is believed to be reliable, no representation or warranty is made concerning the accuracy of any information presented. We have not and will not independently verify this information. Where such sources include opinions and projections, such opinions and projections should be ascribed only to the applicable third party source and not to WFS.
Certain statements herein reflect projections or opinions of future financial or economic performance. Such statements are “forward-looking statements” based on various assumptions, which may not prove to be correct. No representation or warranty can be given that the projections, opinions, or assumptions will prove to be accurate.