Investment Management – Fourth Quarter 2018
We provide a copy of our investment management letter, without enclosures, to keep you up-to-date on the investment markets and West Financial Services.i
“Winter is coming” is the House Stark motto in the HBO series Game of Thrones, which can be interpreted as one needs to stay vigilant for what lies ahead. Similar to the Starks, equity markets are always assessing and reassessing what the future holds. While there are moments where confidence is high, there are also periods where signals are mixed and volatility reigns; and there was no shortage of volatility in the fourth quarter.
Taking a small step back, we entered October with stocks trading at all-time highs, as investors focused on strong domestic earnings growth. Jubilation quickly turned into anxiety as “peak growth” fears increased and mixed economic signals blurred the outlook surrounding domestic and global growth. As a result, equity markets experienced a vicious downturn throughout the remainder of the fourth quarter.
Over the last three months, the large capitalization S&P 500 Index fell 13.5%.ii The mid cap S&P 400 Index and the small cap S&P 600 Index underperformed their large counterpart, falling 17.3% and 20.1%, respectively. International stocks outperformed during the quarter, primarily since they had already experienced a substantial correction earlier in the year.
Performance for various indices for the three-month (not annualized), one-year, three-year and five-year periods appears below:
While domestic economic growth finished 2018 on solid footing, weaker international economies stoked global growth fears. A recent FedEx earnings call summarized the state of the global economy well: “As our volumes and revenues demonstrate, FedEx is experiencing strong growth in the U.S. where the economy remains solid. However, our international business, especially in Europe, weakened significantly since we last talked with you during our earnings call in September. In addition, China's economy has weakened due in part to trade disputes.”
Meanwhile, the domestic economy is still growing, though recent data suggests a material deceleration. December’s ISM Manufacturing number fell to a level not seen since November 2016, while housing has slowed for the last several quarters. On the other hand, robust employment and rising wages are supportive of growth, since consumption in the U.S. represents approximately 70% of gross domestic product. Mastercard’s holiday retail spending report reminded investors how powerful the U.S. consumer is to the domestic economy. “According to Mastercard SpendingPulseTM, holiday sales increased 5.1 percent to more than $850 billion this year – the strongest growth in the last six years.”
In addition to slowing growth, macro and political dynamics are important to monitor since both impact expectations. The trade war with China is a drag on sentiment, which has a negative feedback loop on how companies plan capital expenditures. Another overhang to observe is the March 29th Brexit deadline, the date when the United Kingdom is expected to officially leave the European Union. We believe unforeseen consequences are likely if no agreement is reached. In addition, the European Union is struggling to keep Europe together under increasingly difficult economic and political circumstances.
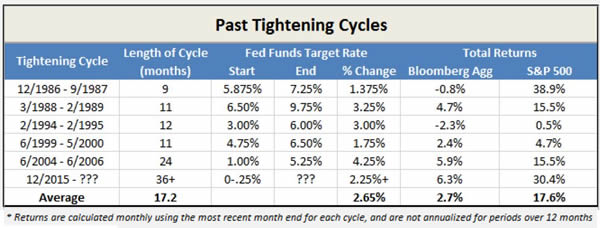
Domestically, fears increased that a potential policy mistake by the Federal Reserve (the Fed) could substantially impact future growth. The Fed has been tightening monetary policy through interest rate hikes, as well as quantitative tightening – which is another way to describe shrinking the balance sheet. On December 19, the Federal Open Market Committee (FOMC) voted unanimously to increase the fed funds rate for the fourth time this year, bringing it to a range of 2.25%-2.5%. This was the ninth increase since 2015. The Fed is working towards the “neutral rate” where interest rates will neither stall growth nor speed it up. Unfortunately, a “neutral rate” is only an estimate which can change with economic conditions. During a press conference after the December 19th meeting, we believe the Fed Chairman Powell appeared out of touch with market consensus, given the markets’ short-term liquidity concerns. He suggested two further rate increases were warranted in 2019, which was in conflict with expectations and the market decline accelerated.
Overall, our interpretation of the tea leaves is that our economy is still growing, despite being the 2nd longest expansion in U.S. history. We view the pullback in stocks as a fear-induced buying opportunity. J.P. Morgan is forecasting the U.S. economy to grow 2.4% in 2019. Corporate earnings are similarly expected to grow, though earnings expectations are being revised downwards. According to FactSet, consensus expectations for S&P 500 earnings-per-share growth are 8%. Valuations are attractive, with the price-to-earnings multiple of the S&P 500 now trading at a 10% discount to its 25-year average.
Regarding fixed income, a flight to safety drove the 10-year Treasury yield down to 2.63% by year-end, slightly higher than where we started the year at 2.40%. In October, 10-year Treasury yields briefly touched 3.25% after a very positive employment report. The higher yields allowed us to reinvest maturities at higher rates, representing yields we have not seen in many years. During that short period of time, we were able to buy one-year bonds at yields of approximately 3% and eight-year bonds (the length of our ladder) with yields slightly above 4%. Municipal bonds continue to be attractive for those in the highest tax brackets.
During the year, we monitored investment allocations to keep equities within investment policy guidelines, and slightly above or below target, based on individual conversations. In addition, we kept international and emerging market exposure below our benchmark, actively reduced internal mutual fund expenses and offset capital gains where possible.
Under the new tax law, which included changes in brackets, deductions, and the alternative minimum tax (AMT), individual tax returns may vary widely from previous years. However, the changes should result in lower tax rates for most clients. Please keep us informed about conversations you have with your tax preparer and changes in your tax bracket so we can update our records.
Have you activated your client portal? Not only can you securely view your accounts in our client portal, but you also have the ability to upload documents into your vault. With the recent tax law changes, it is important to have detailed tax information for your taxable accounts, including carryforward loss information. You can securely upload your tax forms into the portal for our review. In addition, you can transmit or receive other required documents through the portal rather than by email or receiving paper copies in the mail. Please call us if you would like to activate your portal. We will be happy to get you started.
We would like to welcome our newest employee, Jonathan Stolz. Jonathan joined West Financial in October as a portfolio manager and is a CFA charterholder. Also in October, Kim Cox was recognized as a “Five Star Wealth Manager by Five Star Professional.”iii Additionally, please join us in congratulating Trey Isom on earning his CFP® designation and Ryan Streilein for earning his CFA charter.
You should have received your portfolio appraisal as of December 31, 2018. We have provided performance numbers for the quarter, one-year, three-year and five-year periods, where applicable. The brokerage firm where your account is held will be sending Form 1099-DIV and 1099-INT information to you directly. Also, the Form 1099 will provide a record of realized gains and/or losses in taxable account(s) as well as any management fees paid directly from your brokerage account(s).
As West Financial Services enters its 37th year, now with 37 employees, we would like to thank you for recommending our firm and your continued confidence in our investment management services. We wish all of you and your families a happy, safe, and prosperous 2019. Should you have any questions regarding your portfolio or financial plans, please do not hesitate to contact us at any time.
|
President
|
Chief Investment Officer
|
Director of Fixed Income
|
|---|---|---|
 |
 |
 |
| Glen J. Buco, CFP® | Glenn Robinson, CFA | Norma Graves, CFP® |
West Financial Services, Inc. offers investment advisory services and is registered with the U.S. Securities and Exchange Commission (“SEC”). SEC registration does not constitute an endorsement of the firm by the SEC nor does it indicate that the firm has attained a particular level of skill or ability. The information contained herein does not constitute investment advice or a recommendation for you to purchase or sell any specific security. You are solely responsible for reviewing the content and for any actions you take or choose not to take based on your review of such content.
Information contained herein was derived from third party sources as indicated. While the information presented herein is believed to be reliable, no representation or warranty is made concerning the accuracy of any information presented. We have not and will not independently verify this information. Where such sources include opinions and projections, such opinions and projections should be ascribed only to the applicable third party source and not to West Financial Services, Inc.
iThe S&P 500 Index, the S&P 400 Index, the S&P 600 Index, the MSCI EAFE Index, the Barclays Credit 1-5 Year Index, the Barclays Cap U.S. Credit Index, the Dow Jones Industrial Average, and the NASDAQ Composite (each, an “Index”) is an unmanaged index of common stocks that is used as a general measure of security market performance, and its performance is not reflective of the performance of any specific investment. The Index comparisons are provided for informational purposes only and should not be used as the basis for making an investment decision. Further, the performance of your account and each Index may not be comparable. There may be significant differences between your account and each Index, including, but not limited to, risk profile, liquidity, volatility and asset comparison. The performance shown for each Index reflects no deduction for client withdrawals, fees or expenses. Accordingly, comparisons against the Index may be of limited use. Investments cannot be made directly into an Index.
iiIndex performance data contained in this letter, unless stated otherwise, is provided by Morningstar, Inc. and is dated as of December 31, 2018.
iiiThe Five Star Professional award program, managed by fivestarprofessional.com, conducts market-specific research throughout the U.S. and Canada to select reputable, specialized, and honest service professionals. Required eligibility criteria: (1) Credentialed as an investment advisory representative or a registered investment advisor; (2) Actively employed as a credentialed professional in the financial services industry for a minimum of five years; (3) Favorable regulatory and compliant history review; (4) Fulfilled their firm review based on internal firm standards; (5) Accepting new clients. Considered eligibility criteria: (1) One-year client retention rate; (2) Five-year client retention rate; (3) Non-institutional discretionary and/or non-discretionary client assets administered; (4) Number of client households served; (5) Education and professional designations. Wealth managers do not pay a fee to be considered or placed on the final list of Five Star Wealth Managers.