Bondpocalypse Now: Redux
Why would any investor want to put money into low-yielding bonds? In the February 2017 edition of our newsletter, we reviewed the state of the bond market considering the consensus opinion that the 30-year bond rally was over. As a reminder of the market conditions at the time, the equities were in the midst of a major rally caused by the surprise Trump victory, “animal spirits” in the business community were running high, and global growth was beginning to synchronize for the first time in many years.
On the bond side of the ledger, prices were in free fall with the 10-year treasury yield rising from around 1.8% before the 2016 election to 2.45% to close out 2016 (bond prices move in the opposite direction as bond yields). The Federal Reserve had already picked the fed funds rate off the mat with a 0.25% increase in 2016, and a 1% increase was the highend prediction for 2017. With this backdrop, much of the financial punditry class were calling for the death of bonds and questioned their value in a portfolio. Having been told about the death of fixed income many times before, we viewed the conventional wisdom with a healthy dose of skepticism. Let’s see how this story has played out over the current Federal Reserve tightening cycle, which seems much closer to the end than the beginning.
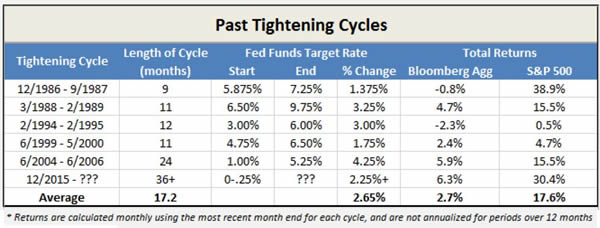
Since our article two years ago, the 10-year yield actually climbed as high as 3.25% before closing out a turbulent 2018 at 2.63%. The Federal Reserve would hike the fed funds rate seven times – three in 2017 and four times in 2018 – to a target range of 2.25% - 2.50%. The total return through 12/31/2018 on a diversified bond portfolio, measured by the Bloomberg Barclays U.S. Aggregate Bond Index, was 6.3% since the Federal Reserve began this tightening cycle in December 2015. Tightening cycles since 1986 have been profitable for equity markets, and this time is no different with the S&P 500 up 30.4% over the same time period.
Equities have certainly outperformed bonds during this cycle, but investors were very happy to have bonds in their portfolios in 2018, particularly the last quarter. The Bloomberg Barclays U.S. Aggregate Bond Index was up 1.6% for the 4th quarter 2018 while the S&P 500 was down over -13%. For investors drawing down their portfolio, the fixed income allocation provided a source of cash that did not need to be sold at steep price declines. It is periods like Q4 2018 that should be a reminder of the value bonds provide portfolios.
Where do we go from here? Nobody knows how much higher the Federal Reserve will increase the fed funds rate, or how much inflation and GDP growth the bond market will price in to longer dated bonds. What we do know is this has been a different tightening cycle in both the length (longer than any since 1986) and pace of rate hikes (slow, the last tightening cycle in 2004 saw almost double the change in fed funds rate in a third less time!). We expect both trends to continue, allowing for the higher yields to offset price declines.
What we also know is the yield-to-maturity of the Bloomberg Barclays U.S. Aggregate Bond Index is currently about 3.3% (as of 1/10/19), which is a measure of return should the underlying bonds be held to maturity. Our general philosophy of fixed income investing is to hold our bonds to maturity, with yields and maturities known. This philosophy provides our clients with assured cash flow for when equity market volatility coincides with life events.

Referrals of family, friends and colleagues who may benefit from financial planning and investment management guidance are always welcome. Thank you for recommending West Financial Services.
Disclosures
-
Registration does not imply a certain level of skill or training.
-
Information contained herein was derived from third party sources including Bloomberg, Standard & Poor’s, Dow Jones & Company, the Federal Reserve Bank of New York, and Morningstar, Inc. While the information presented herein is believed to be reliable, no representation or warranty is made concerning the accuracy of any information presented. We have not and will not independently verify this information.
Please contact us if you would like to obtain a copy of the third party sources.

